Under Solvency II, insurers and reinsurers are required to publish solvency and financial condition reports (SFCRs). The SFCRs contain a significant amount of information, including details on business performance, risk profile, balance sheet and capital position. In this briefing note, we give an overview of our main observations after analysing the year-end (YE) 2025 SFCRs of Belgian insurers.1
In this briefing note, we consider the publicly available SFCRs for most Belgian insurance companies between YE 2016 and YE 2025.
The list of insurers that we included can be found in the appendix at the end of this briefing note. The total assets included in this analysis sum up to about €338 billion, representing around 93% of the total assets of insurers based in Belgium. The remaining 7% consist of entities that were recently acquired, are in runoff, or for which full SFCR data is not available.
We included 32 insurers in our analysis. Figure 1 presents the top 10 Belgian insurance companies by assets under management for YE 2025. Together, they account for about 81% of the Belgian market. Naturally the extent of this coverage can change when assessing alternative measures such as gross written premiums (GWP) or eligible own funds (EOF).
Due to the relatively small number of non-composite insurers, we do not distinguish between composite, life and non-life insurers in this briefing note.
Figure 1: Reported total market value of assets for YE 2025 as an amount in Euros and as a percentage of the total sample
| RANK | INSURER | MV ASSETS (€ BN) YE2025 |
MKT SHARE (%) YE2025 |
MV ASSETS (€ BN) YE2024 |
MKT SHARE (%) YE2024 |
|---|---|---|---|---|---|
| 1 | AG Insurance | 75.61 | 22.40% | 74.81 | 22.67% |
| 2 | KBC Insurance | 37.30 | 11.05% | 34.99 | 10.60% |
| 3 | AXA BELGIUM | 36.82 | 10.91% | 37.36 | 11.32% |
| 4 | Allianz Benelux | 25.73 | 7.62% | 24.06 | 7.29% |
| 5 | Belfius Insurance | 21.25 | 6.29% | 20.11 | 6.09% |
| 6 | P&V Assurances | 20.47 | 6.06% | 20.13 | 6.10% |
| 7 | Ethias | 19.64 | 5.82% | 19.14 | 5.80% |
| 8 | Baloise Belgium | 12.60 | 3.73% | 12.51 | 3.79% |
| 9 | Athora Belgium | 12.24 | 3.63% | 11.35 | 3.44% |
| 10 | NN | 11.38 | 3.37% | 11.40 | 3.45% |
If we compare these market shares with those of previous years, we see that AXA Belgium lost market share at YE 2025, whereas KBC Insurance and Allianz Benelux increased their market share.
More information on the insurers in this briefing note is available in our free online SFCR dashboard, which provides detailed figures on Belgian insurers at the entity level. Please contact your Milliman consultant to gain access to this dashboard.
Solvency capital requirement coverage ratios: How did Belgian companies do?
Overall, the Belgian insurers analysed are well capitalised as of YE 2025, with a weighted-average solvency capital requirement (SCR) coverage ratio of 195%.3 This represents an increase of over 10% compared to the 185% figure for YE 2024. In general, this increase is a consequence of favourable financial market conditions characterised by increasing equity markets, lower spreads and increasing discount rates, leading to an increase in the excess of assets over liabilities.
While showing a material increase at the aggregate level in comparison to YE 2024, the SCR coverage ratios evolved differently at the company level. The same holds for the underlying reasons driving the individual evolution of SCR coverage ratios.
Starting with some of the companies that have improved their solvency positions, AG Insurance saw its ratio increase by 33 percentage points (pp), from 180% at YE 2024 to 213% at YE 2025. Next to the impact of favourable financial market conditions stated previously, this was also due to an increased diversification benefit in the capital requirement for market risk which is a result of the integration of Saba Group into Interparking.
Argenta Assuranties has seen its SCR coverage ratio increase by 35pp, from 196% at YE 2024 to 231% at YE 2025. Some main drivers for this increase were favourable financial market conditions, lower expense reserves and higher than expected premium indexation on the health insurance portfolio.
Monument Assurance has seen its SCR coverage ratio increase by 41pp, from 279% at YE 2024 to 320% at YE 2025. This increase is partially driven by a decrease in capital requirements due to a further spread optimalization for infrastructure debt investments. The increasing ratio is partially offset by the EOF lowering due to the acquisition of the corporate business Contassur portfolio.
Figure 2: Reported SCR coverage ratios for YE 2023, YE 2024 and YE 2025
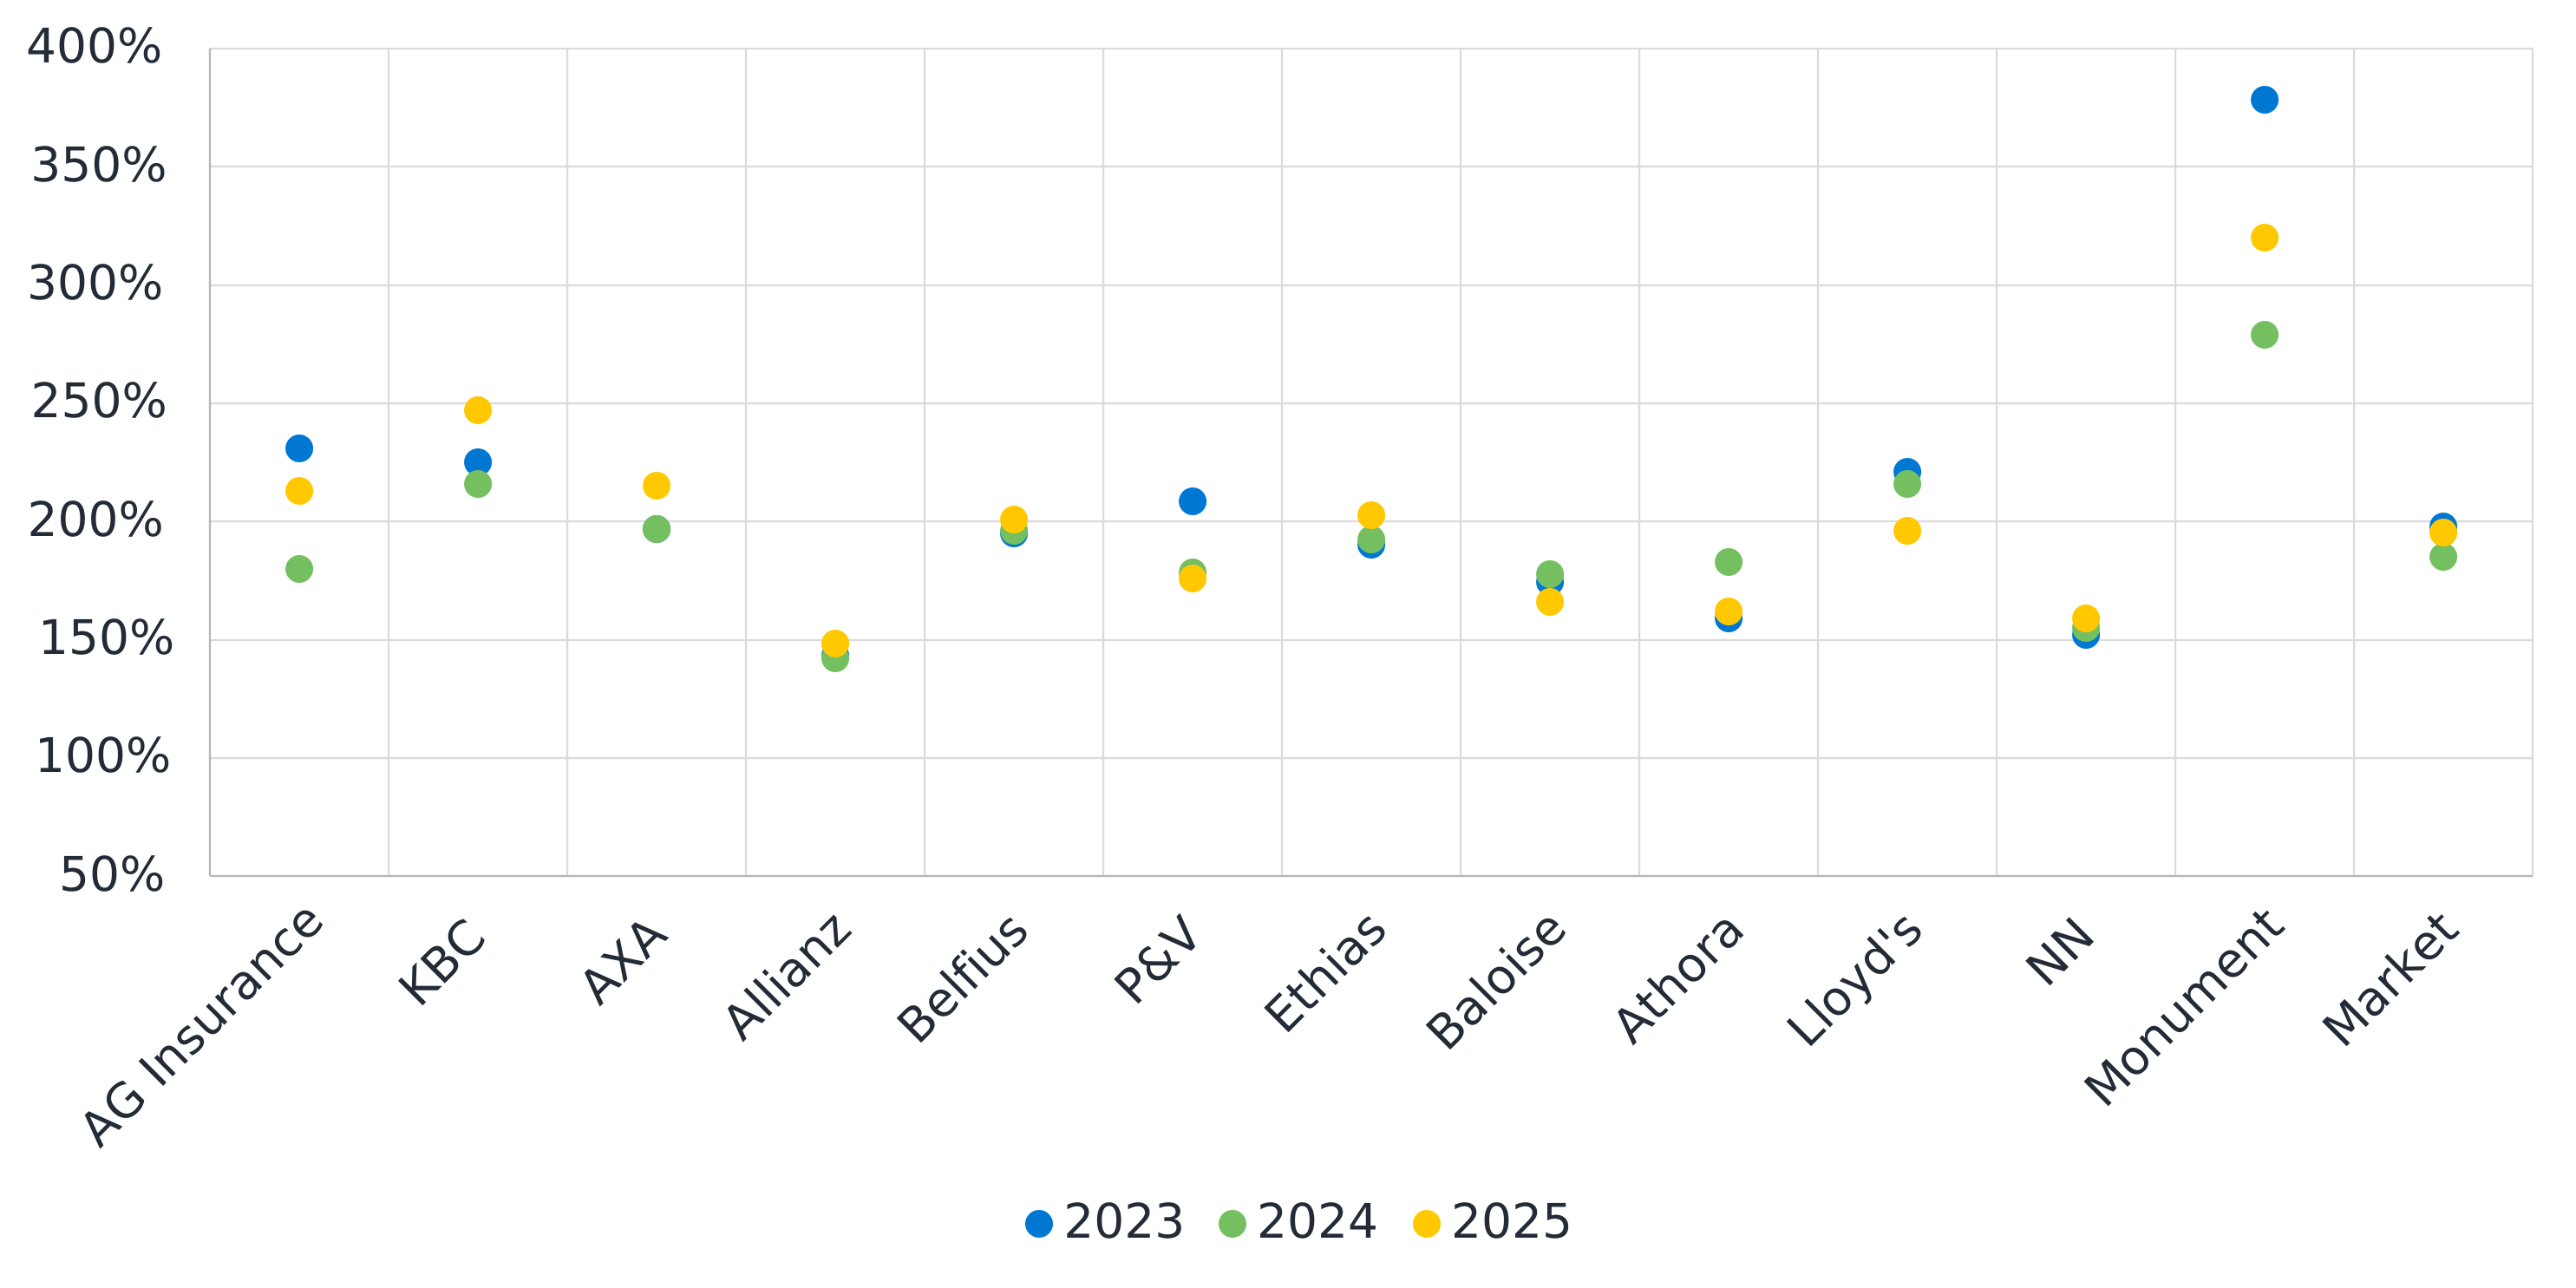
QBE Europe saw its ratio increase from 123% to 151%. One of the reasons for this is that they entered a retrospective reinsurance arrangement covering certain prior-year claim reserves which decreases the underwriting risk underlying its SCR. Partially offsetting this are increases to most risk areas following increased planned exposure and increased technical provisions (TP) from recent growth.
Regarding the companies that have seen a reduction in their SCR coverage ratios, Athora Belgium has seen its SCR coverage ratio decrease by 21pp, from 183% at YE 2024 to 162% at YE 2025. This decrease is resulting from—among others—an increase in capital requirements for mass lapse risk and an increased exposure to cash leading to a higher capital requirement for counterparty default risk.
The SCR coverage ratio of DAS decreased from 206% at YE 2024 to 150% at YE 2025 due to a sharp decrease in the level of EOF from €61 million at YE 2024 to €45 million at YE 2025. This drop in EOF is the result of an increase in the level of TP to address higher than expected insurance payouts due to rising legal costs. The total SCR of DAS remained stable at around €29 million.
Overall, Belgian companies are well capitalised, with over 70% of the market being represented by insurers with a ratio equal to or above 180% (generally considered the ratio where companies can start paying out dividends).
SCR—standard formula
In Figure 3, we present the breakdown by risk component of the aggregated SCR for insurers that report on a Solvency II standard formula (SF) basis and those using a partial internal model (PIM).
Figure 3: Solvency II SF SCR breakdown per sub-module for YE 2025
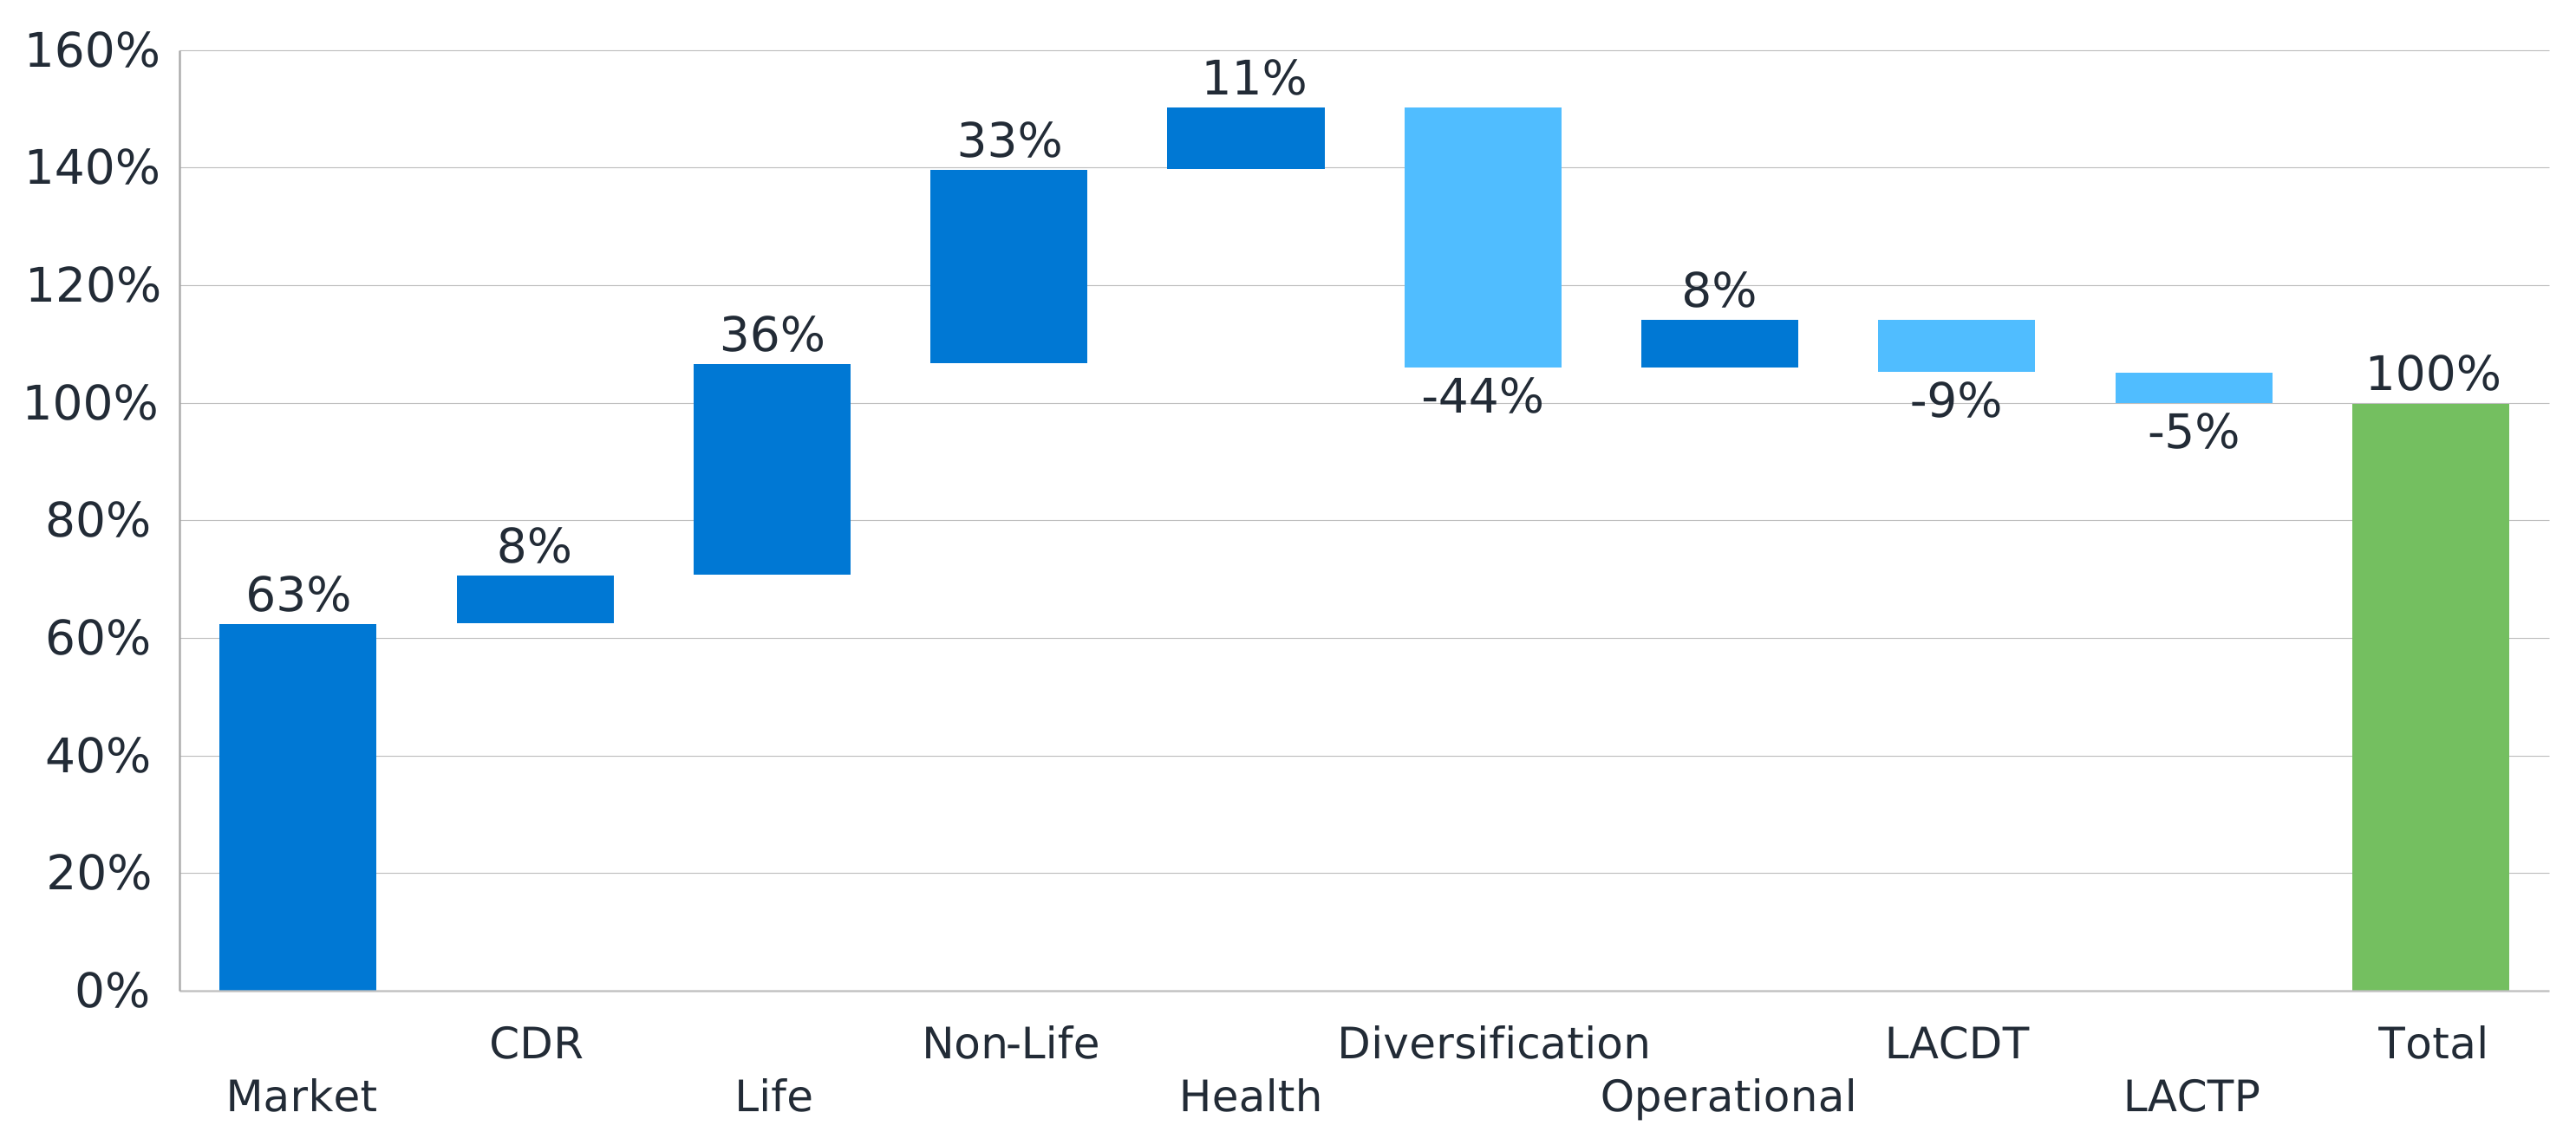
We see that market risk is by far the biggest risk, followed by life underwriting and non-life underwriting risks. Compared to YE 2024, the average risk profile of a Belgian insurance company remained relatively stable. Whereas life and non-life underwriting risks show an increase in SCR (30% and 32% for YE 2024, respectively), counterparty default, health underwriting and operational risks show a slight decrease (9%, 12% and 9% for YE 2024, respectively) and market risk remains at the same level. The average diversification benefit remains stable (41% for YE 2024).4
Belgian life insurers continue to have, on average, substantial loss-absorbing capacity of TP (LAC TP), lowering the overall reported SCR. This is primarily driven by several insurers having substantial amounts of discretionary profit-sharing on their balance sheets. The offsetting impact of the LAC TP on the SCR increased from 4% for YE 2024 to 5% for YE 2025.
Finally, the offsetting impact of the loss-absorbing capacity of deferred taxes (LAC DT) remains stable at 9%. Generally, Belgian insurers have reported stable ratios of LAC DT to total SCR, yet some companies have shown significant variations. Companies like ACM Life, AXA Belgium, Cigna Life and Cigna Europe significantly increased their LAC DT. On the other hand, Allianz Benelux and DAS reported no LAC DT benefit during YE 2025, although they did report a LAC DT benefit at YE 2024.
Volatility adjustment
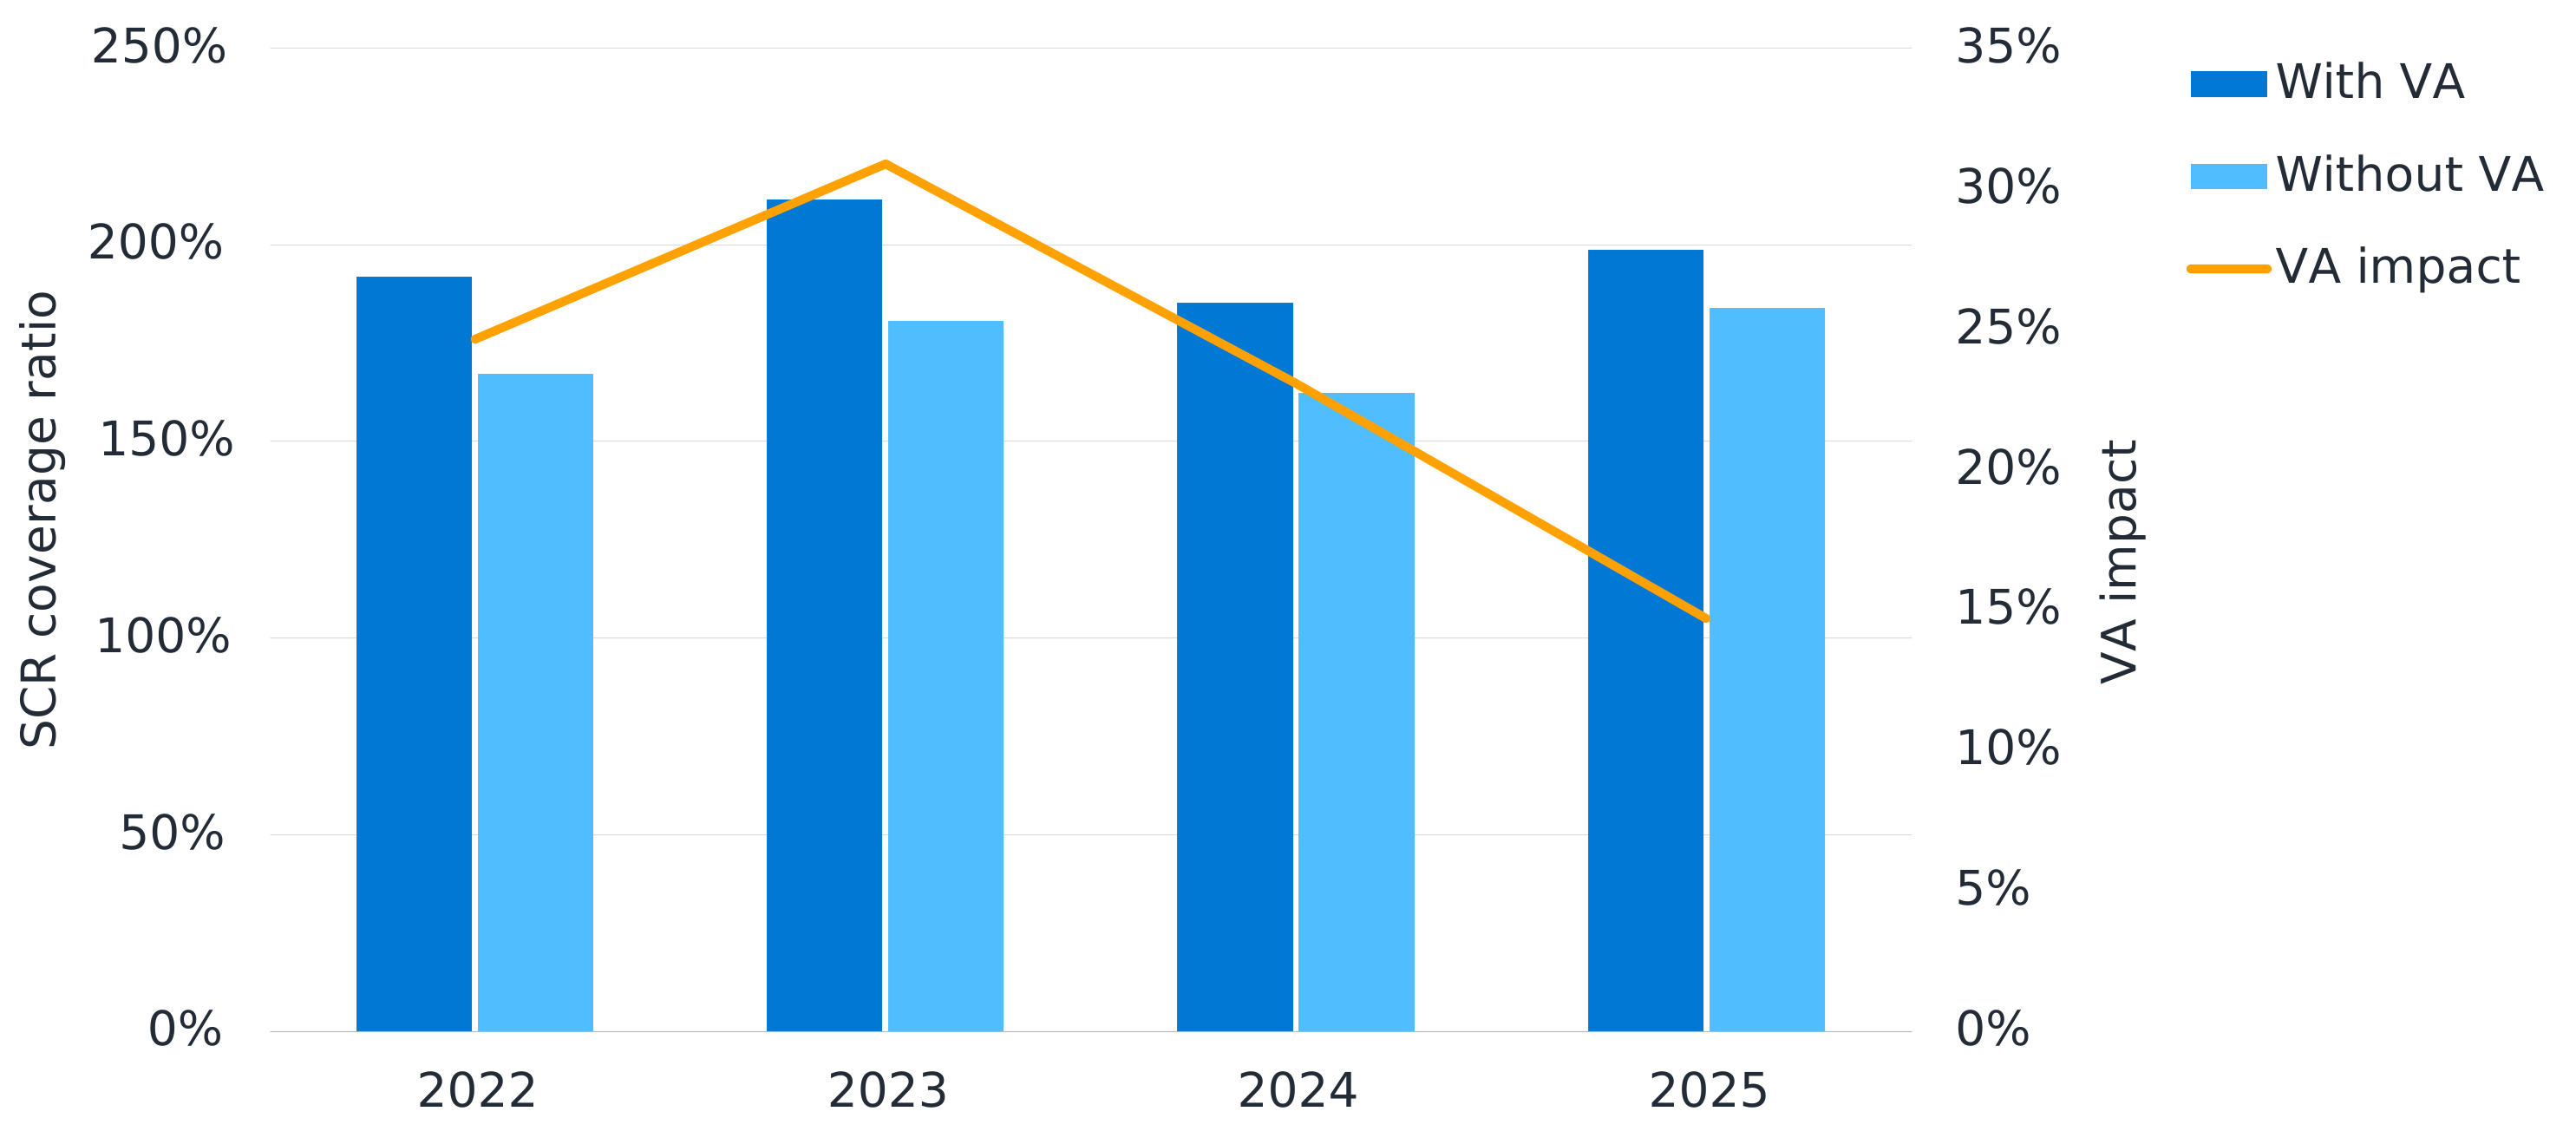
The volatility adjustment (VA) has been a widespread long-term guarantee measure among Belgian life insurers. To show the effect of these measures, Figure 4 displays the SCR coverage ratio of aggregated Belgian insurers with and without VA.
Of the 32 insurers analysed, 21 reported VA impacts in their QRTs. There is a clear difference between the impact of the VA seen at companies that report their SCR based on the SF and those that have an internal model (IM) in place. The average VA impact on the SCR is 7% and 27% for SF and IM companies, respectively. This is in line with expectations, as mechanisms increasing the ratio, such as the dynamic VA, only apply to IM companies.
We primarily considered solo entities for this analysis. The VA might be applied at the group level as well.
Figure 4: Average impact of the VA on the SCR coverage ratio on the Belgian market
Analysis of LAC DT and LAC TP
For YE 2025, 16 of the 32 insurers analysed allowed for LAC DT and 10 for LAC TP in their SCR. Both LAC DT and LAC TP are especially high for insurers with large books of life insurance business. This is in line with expectations, as both are driven by the insurers’ underlying life underwriting business. Discretionary profit-sharing causes the LAC TP to be high, especially for life insurers. Furthermore, the longer duration of their liabilities enables companies to allow for a deferred tax liability (DTL) on their balance sheets more easily, creating a higher LAC DT potential.
Analysis of own funds
EOF are divided into three tiers based on quality: Tier 1 capital is the highest ranking with the greatest loss absorbing capacity (LAC), such as retained earnings and share capital; Tier 2 funds are typically composed of hybrid debt; and Tier 3 typically comprises deferred tax assets. As shown in Figure 5, Belgian insurers’ EOF can be considered of good quality, with approximately 85% qualifying as Tier 1. Additionally, this allocation to Tier 1 capital remained relatively stable over previous years.
At the company level, there is considerable divergence in the extent to which Belgian insurers have Tier 2 or Tier 3 capital. For YE 2025, there are 17 insurers with Tier 2 capital. On average, their Tier 2 capital accounts for approximately 11% of the EOF and, for one insurer, it reaches up to 30%.
Figure 5: Structure of EOF for Belgian insurers for YE 2023, YE 2024 and YE 2025
| EOF CATEGORY | FY2023 | FY2024 | FY2025 |
|---|---|---|---|
| Tier 1 – unrestricted | 85% | 85% | 87% |
| Tier 1 – restricted | 1% | 1% | 0% |
| Tier 2 | 12% | 12% | 11% |
| Tier 3 | 2% | 2% | 1% |
Figure 6: Belgian insurers with an allocation to Tier 1 – unrestricted EOF of less than 80%
| INSURER | TIER 1 - UNRESTRICTED |
TIER 1 - RESTRICTED |
TIER 2 | TIER 3 |
|---|---|---|---|---|
| Belfius | 79.31% | 0.00% | 15.64% | 5.05% |
| P&V | 78.98% | 0.00% | 19.59% | 1.43% |
| NN | 78.85% | 6.16% | 12.24% | 2.76% |
| QBE | 78.15% | 0.00% | 21.60% | 0.26% |
| Ethias | 74.91% | 0.41% | 20.83% | 3.85% |
| Baloise | 74.3% | 0.0% | 22.8% | 2.9% |
| EMANI | 70.01% | 0.00% | 29.99% | 0.00% |
| Athora | 57.43% | 11.67% | 21.78% | 9.12% |
An overview of Belgian insurance companies that allocate most of their EOF to Tier 2 and Tier 3 is presented in Figure 6. The companies listed in Figure 6 all have allocations to Tier 1 capital under 80%.
Analysis of investments
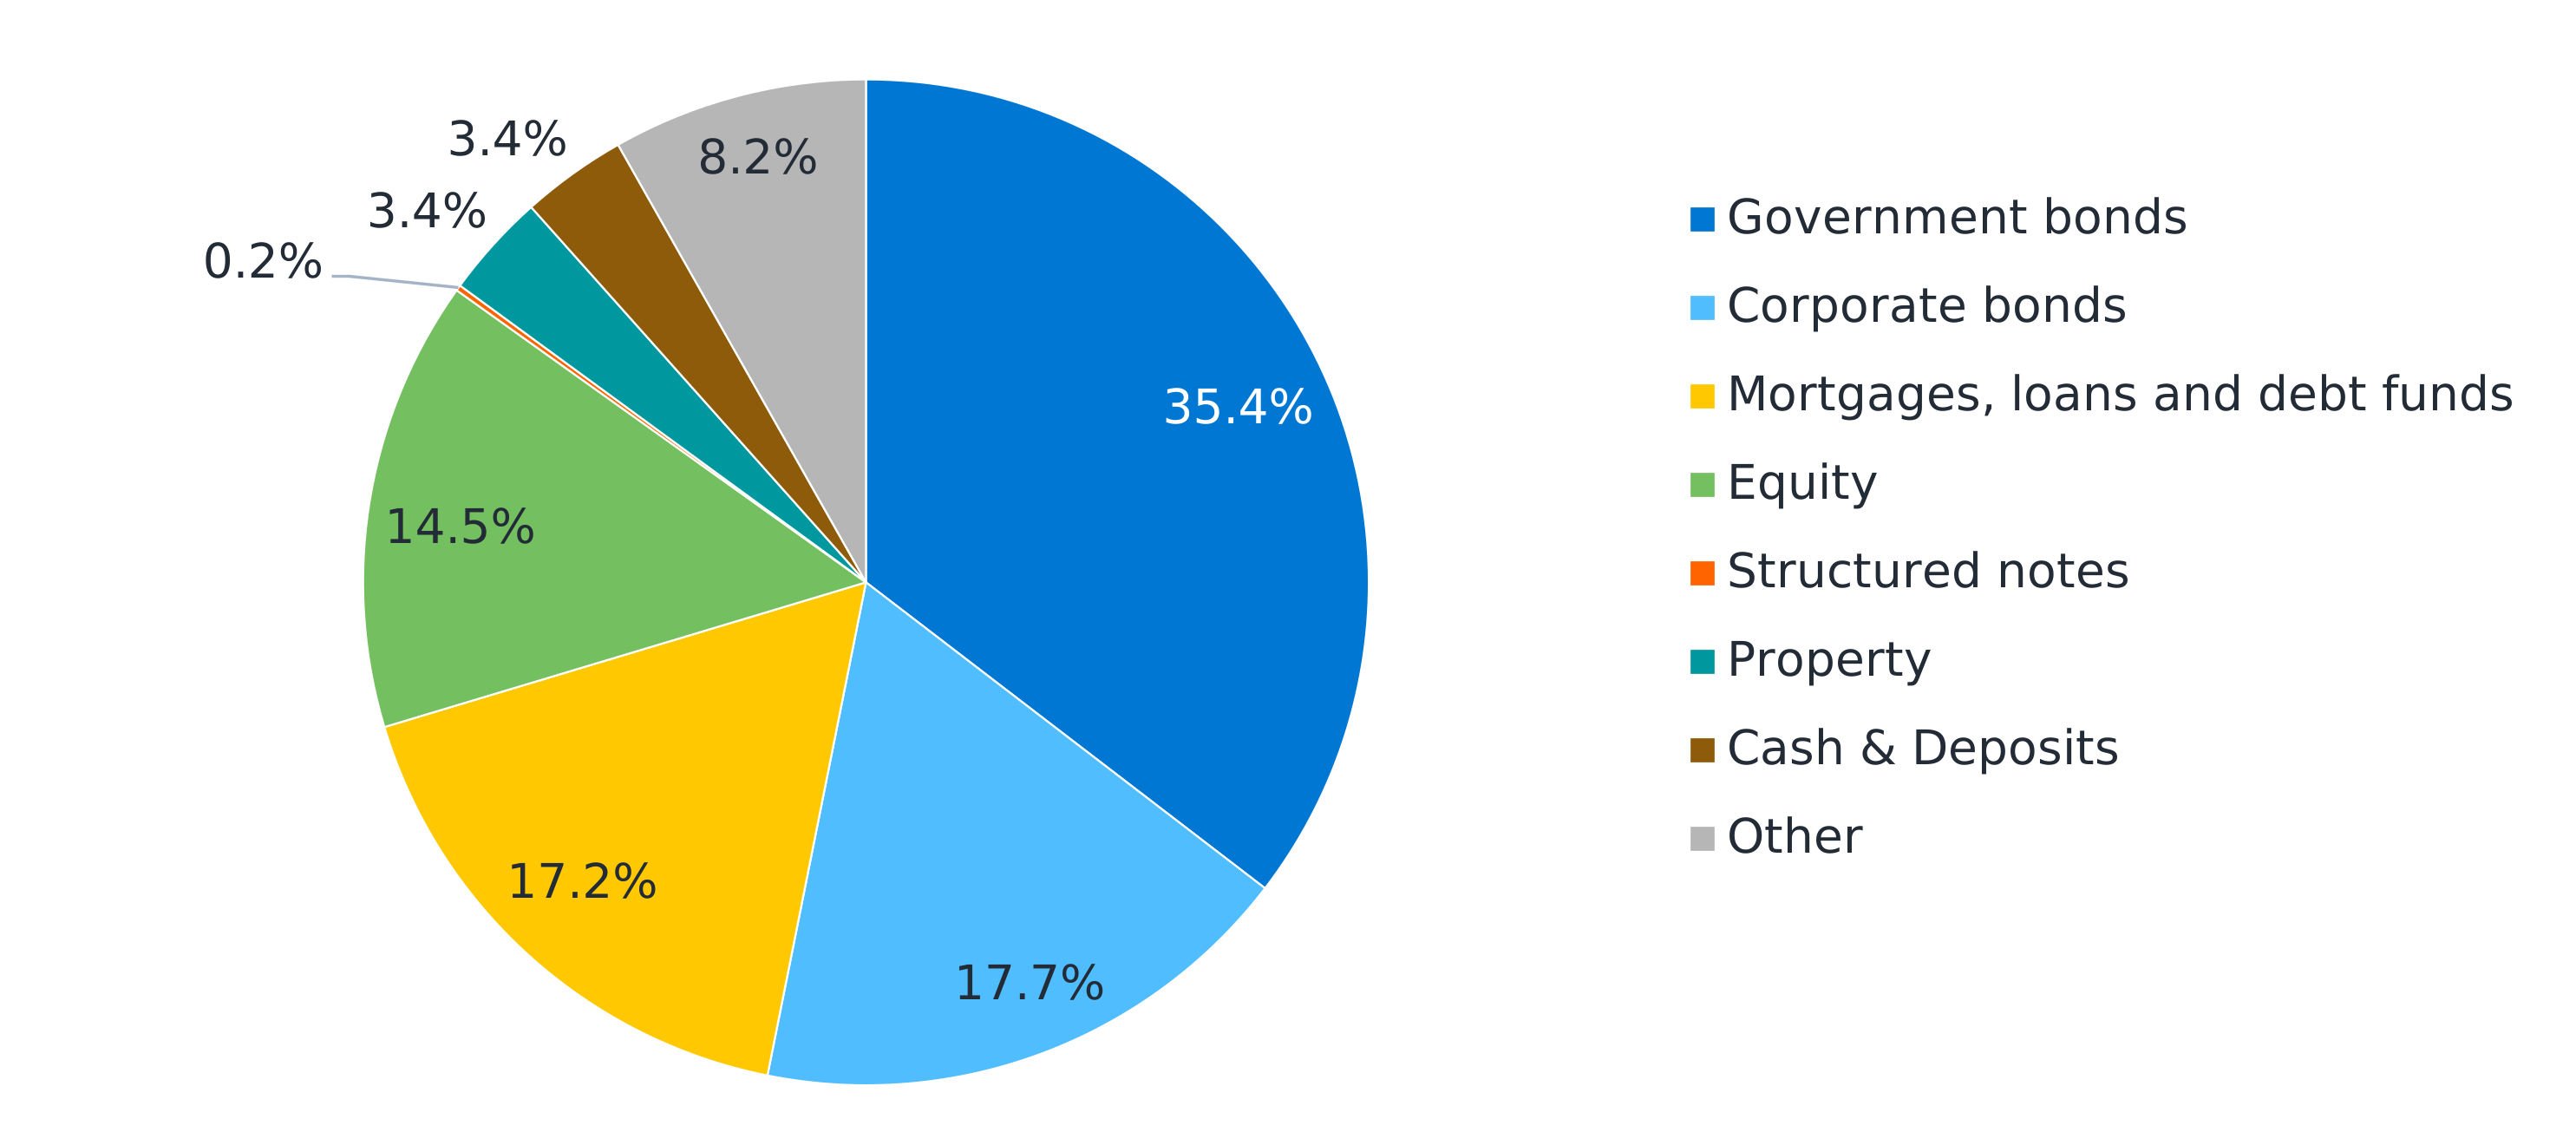
Investments are the largest component of the asset side of the selected insurers. Figure 7 shows the breakdown of companies’ aggregate investments (including cash).
Generally, the investment mix of Belgian insurers for YE 2025 shows little difference compared to the investment mix for YE 2024. For YE 2025, Belgian insurers continue investing mostly in government and corporate bonds, loans, mortgages, and equity in very similar proportions, as was the case at YE 2024.
Compared to other European countries, Belgian insurers invest—in aggregate—significantly more in government bonds, loans and mortgages, and less in equity, CIU and structured notes. This is in line with previous years.
Investments in bonds (both government and corporate), loans and mortgages are prominent for the majority of Belgian insurance companies. These fixed-income type assets are attractive to insurers due to the regular payment streams, which complement duration-matching strategies, reduced volatility and the associated capital requirements relative to equities. Moreover, Belgian government bonds are especially attractive due to their linkage to profit-sharing applicable to life products. For these reasons, companies that write life insurance business have material positions in these asset classes.
Compared to their composite and life insurance counterparts, Belgian non-life insurers have above-average holdings in related undertakings and participations. This view is somewhat distorted by entities whose assets are primarily dominated by shares in separate investment vehicles that classify as participations under Solvency II.
Non-life insurers also have above-average cash positions. This is in line with expectations, given the relatively short duration of their liabilities and the related need for liquidity.
Figure 7: Belgian insurers’ average investment mix
Analysis of technical provisions (TP)
TP make up the largest liability on Belgian insurers’ balance sheets. For both life and composite insurers, TP are dominated by non-linked life insurance obligations.
When looking at reinsurance covers in place for the larger insurance companies, we see that Athora Belgium, Monument Assurance, ERGO Insurance, Cigna Europe and DAS all have a relatively large portion of their balance sheet reinsured. The same holds for several of the smaller non-life-focused insurers, which is in line with expectations due to their small size and business models.
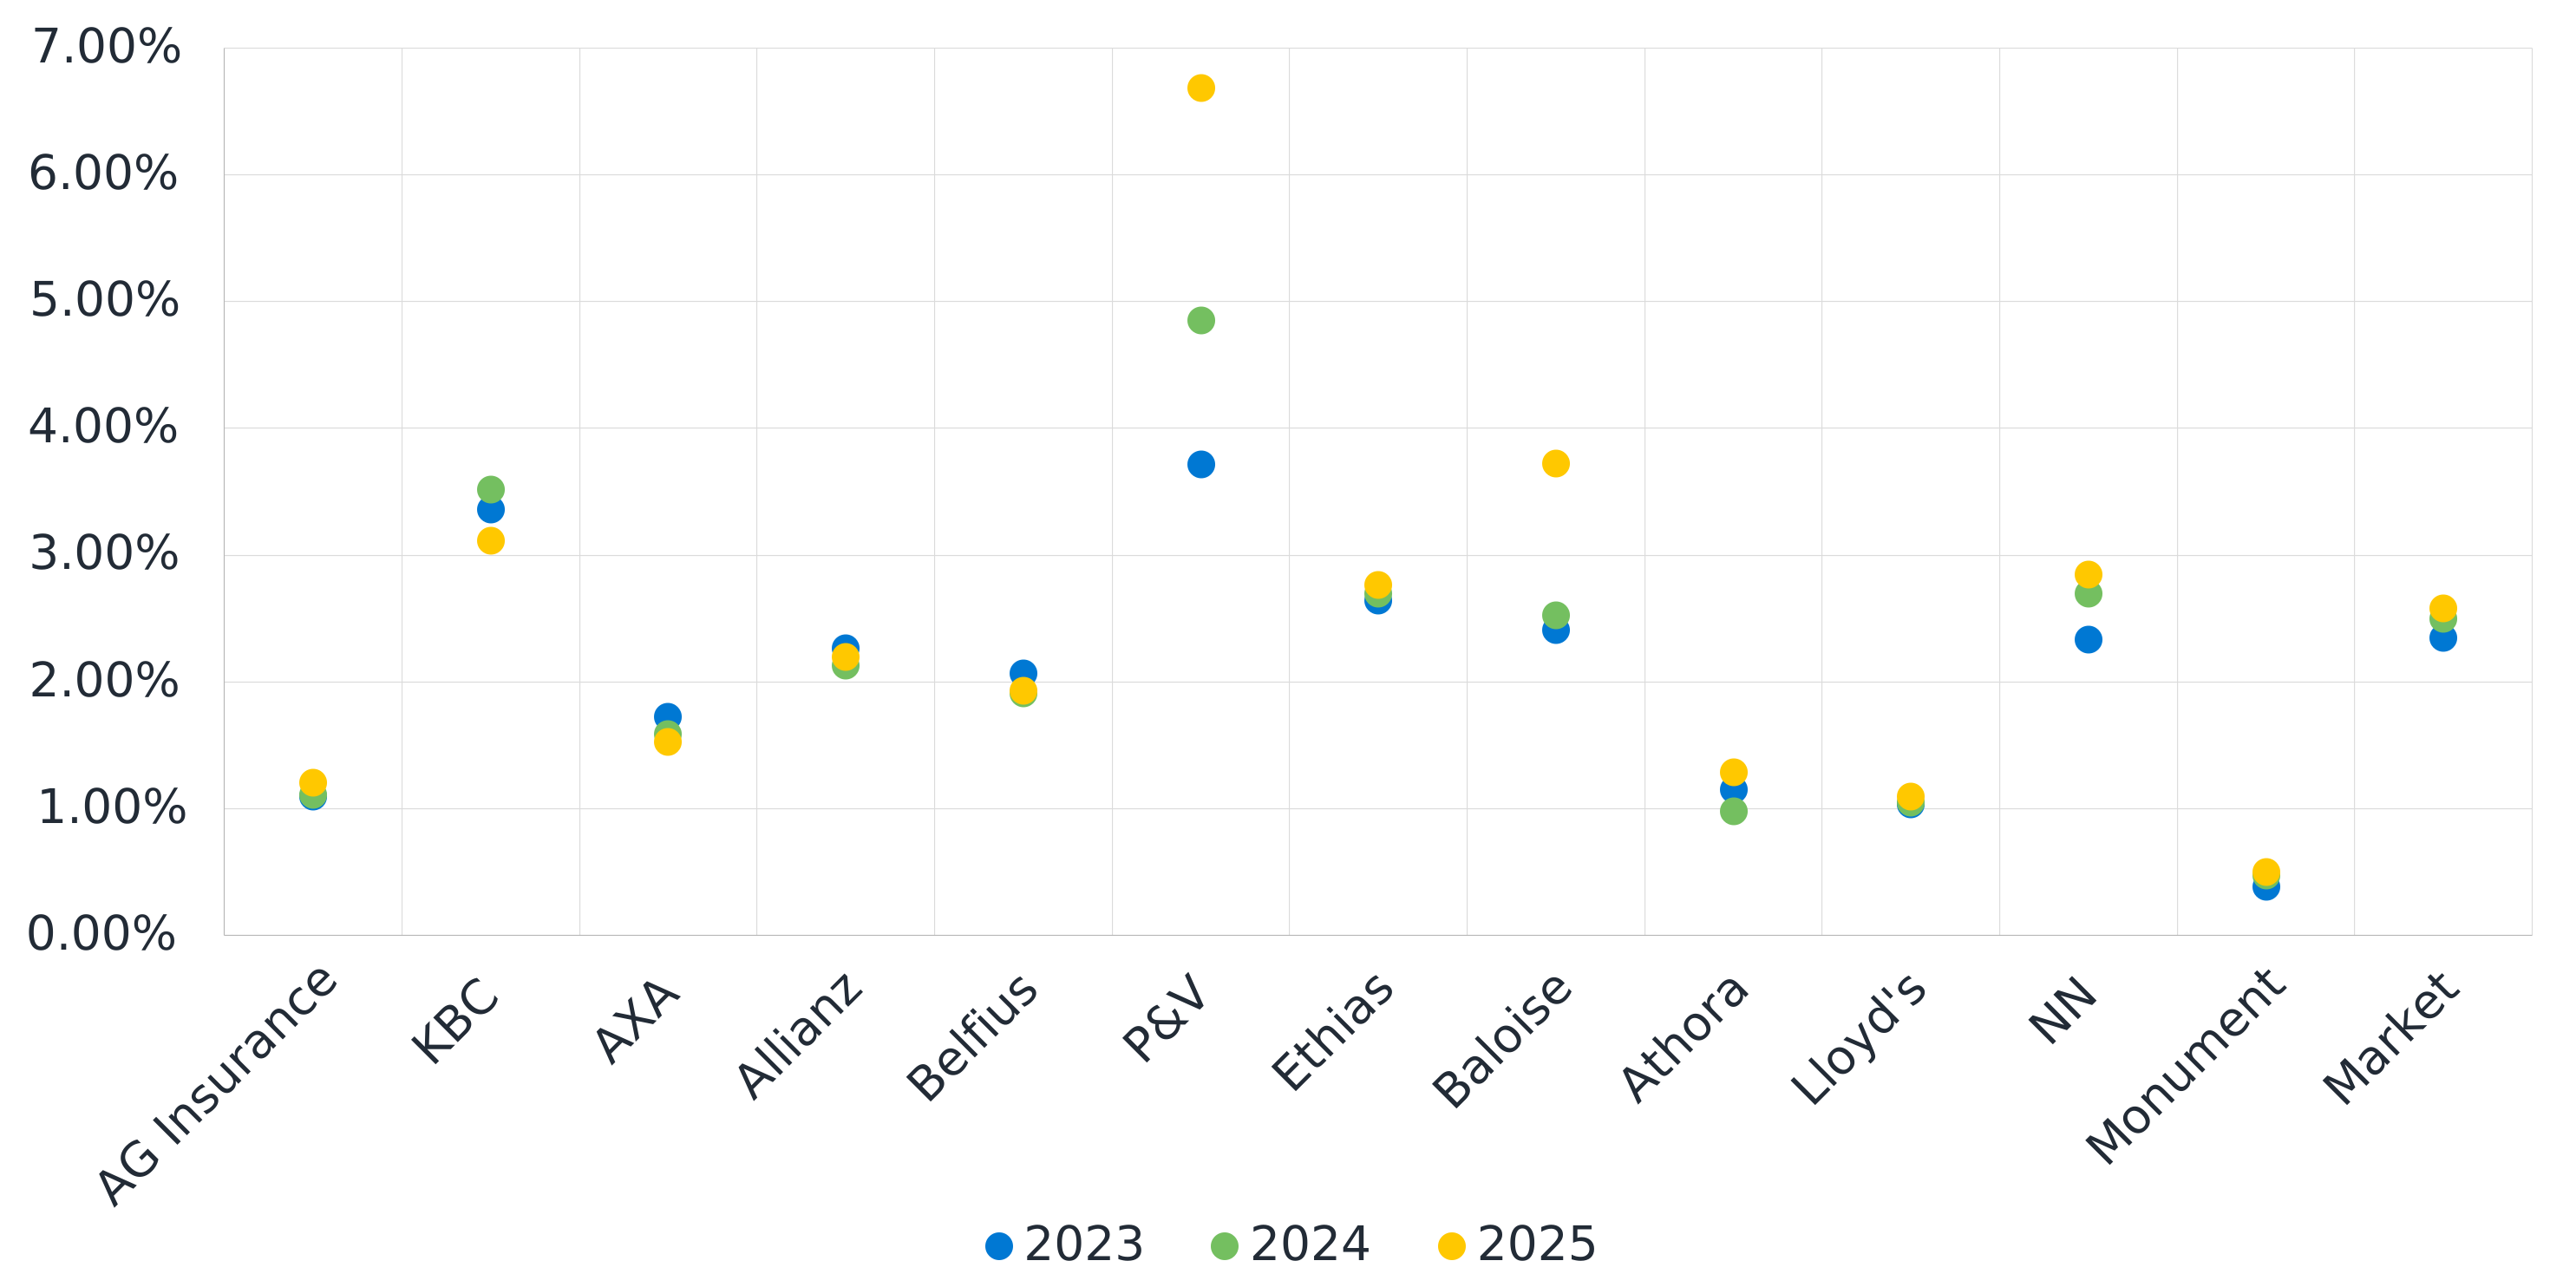
Focusing on the risk margin as a percentage of the gross TP, as shown in Figure 8, we see that KBC Insurance, P&V Assurances, Ethias, Baloise Belgium and NN Insurance have relatively high-risk margins when compared to the market. One potential reason for this could be long duration life and health insurance business on their balance sheet, combined with material underwriting risks such as lapse, expense, inflation, morbidity and longevity.
Figure 8: Risk margin as a percentage of the gross tp for YE 2023, YE 2024 and YE 2025
Analysis of premiums
In Figure 9, we show the insurance companies with the largest volumes of GWP at YE 2025 for both life and non-life insurance lines of business. The 10 insurers shown on the left in Figure 9 account for over 90% of the total GWP for life insurance in the Belgian market; the 10 insurers shown on the right account for over 66% of the total GWP for non-life insurance.5
Figure 9: Market share of GWP life and non-life for YE 2025
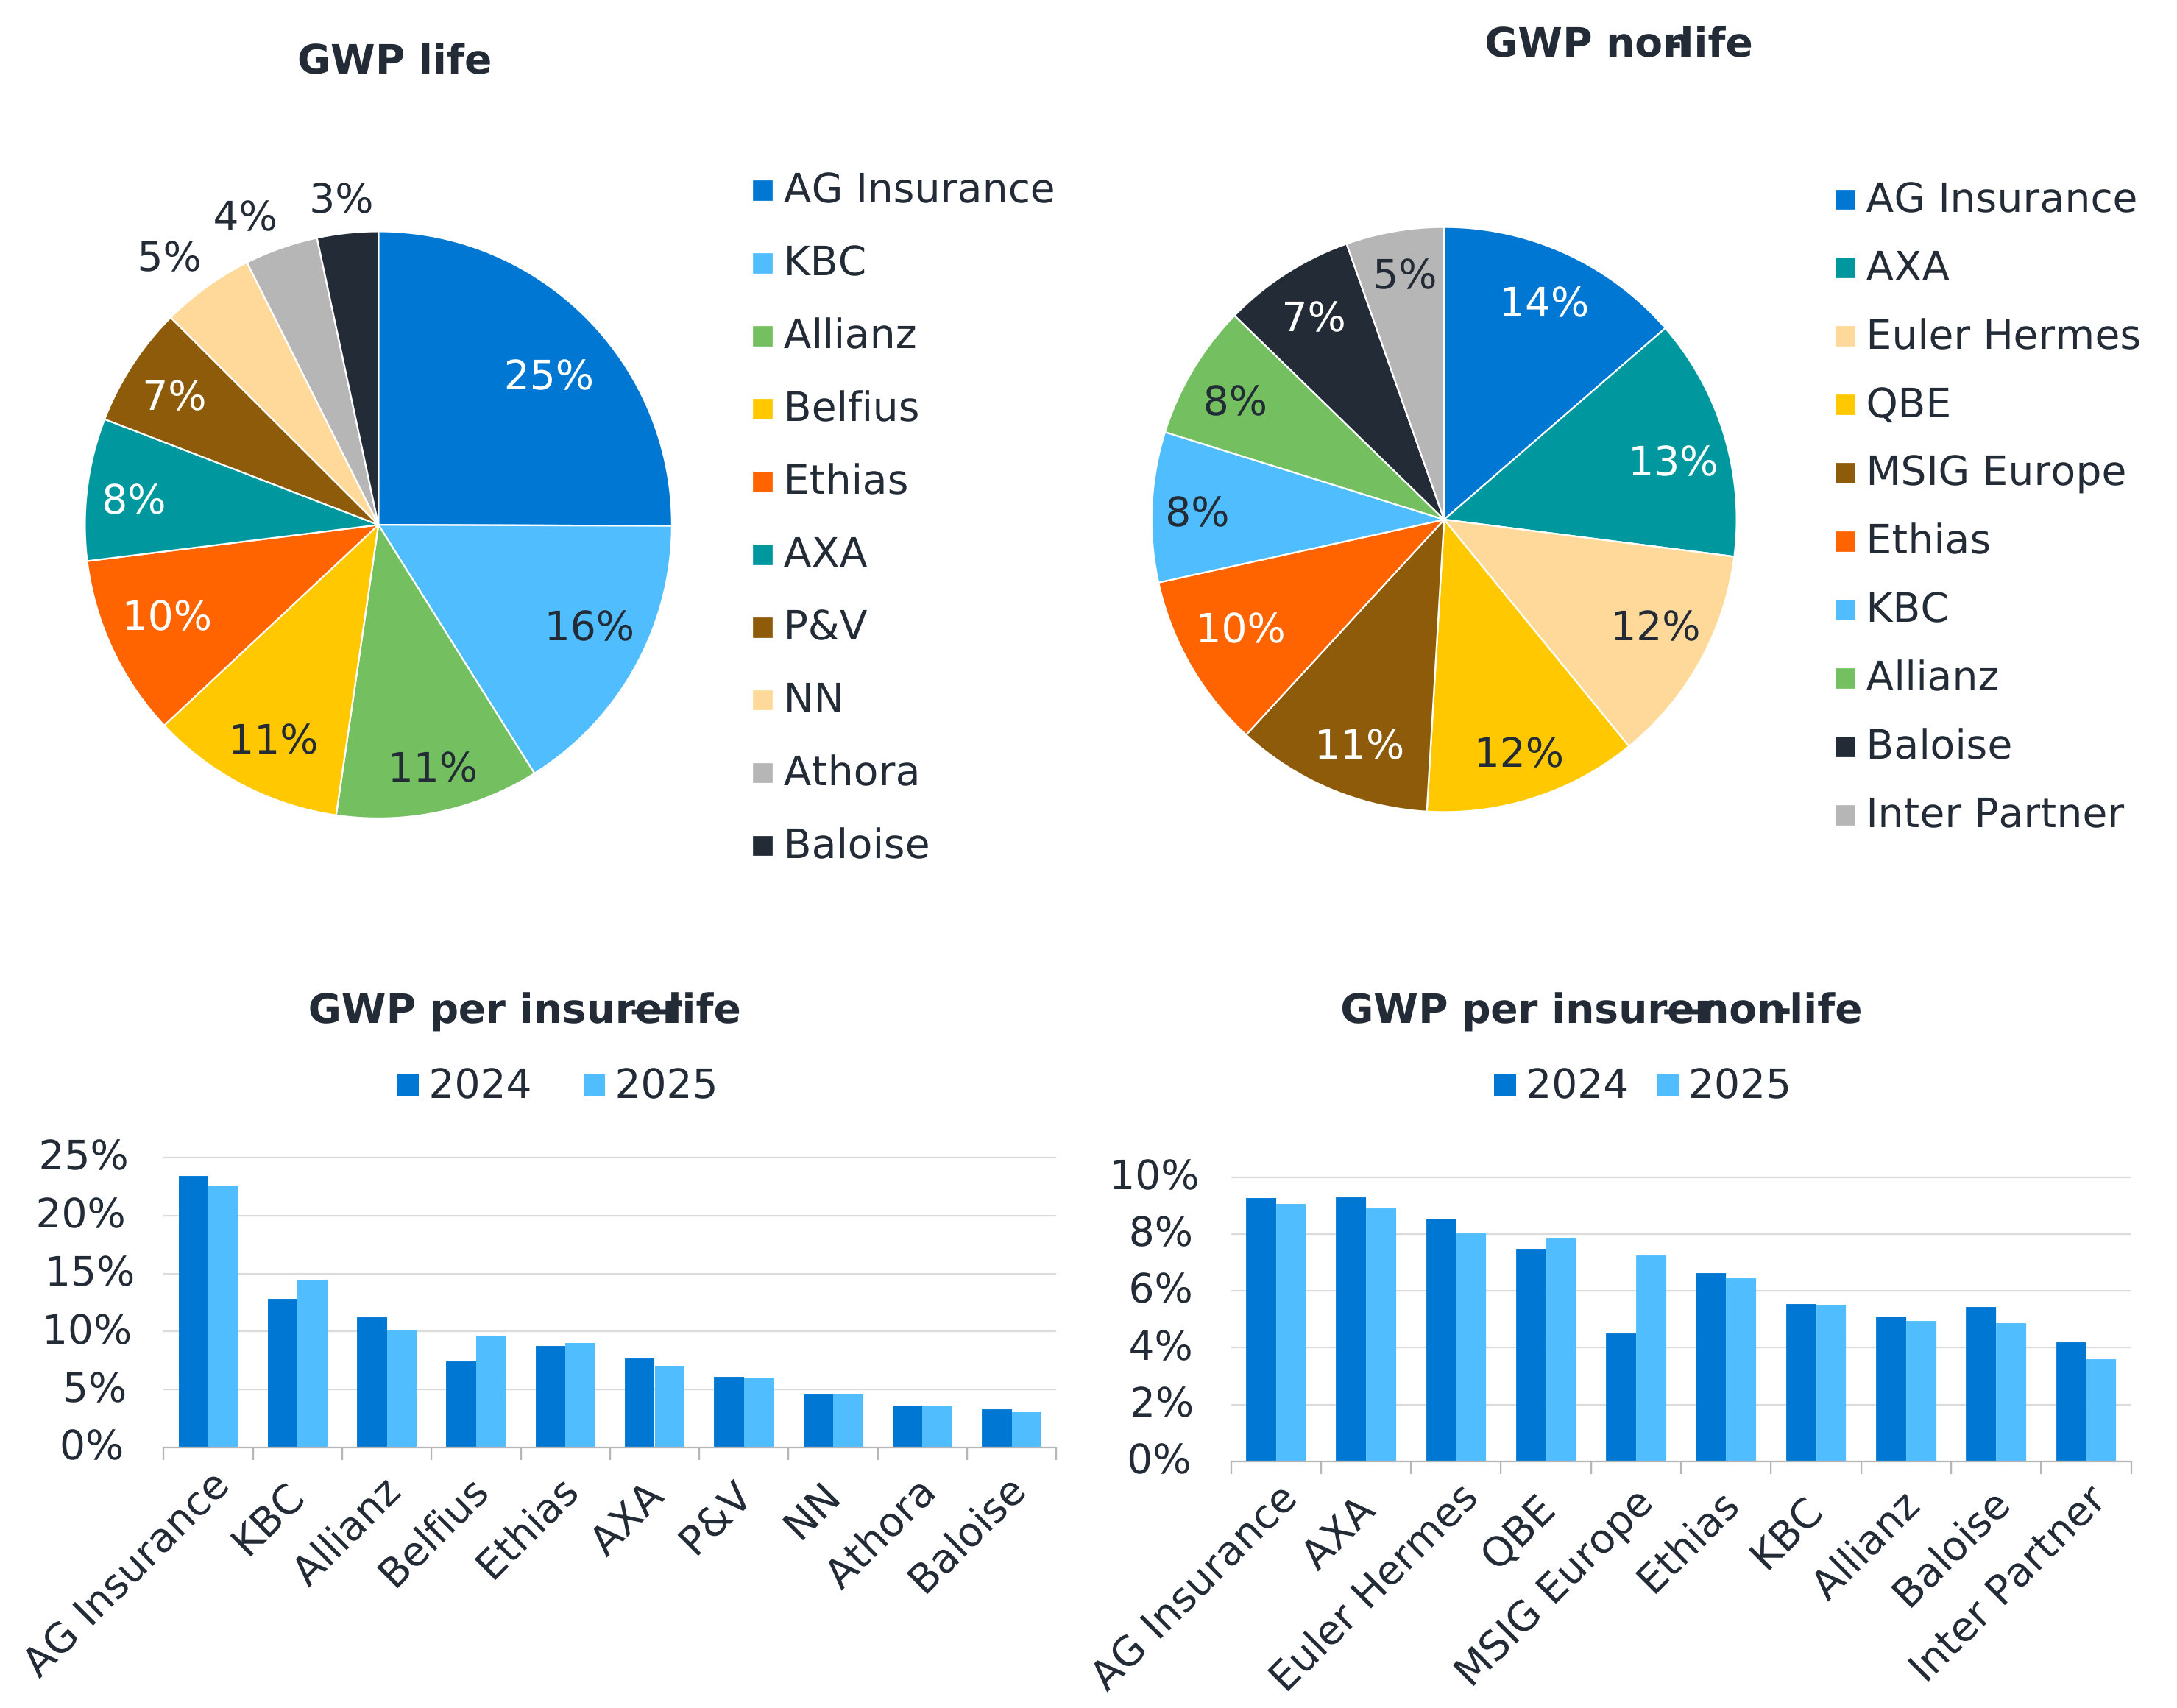
Compared to YE 2024, the life insurance GWP market shares of Belfius Insurance and KBC Insurance increased at YE 2025. On the other hand, AG Insurance, Allianz Benelux and AXA Belgium saw a decrease in their market share in terms of GWP as compared to YE 2024.
On the non-life side, market shares in terms of GWP remain relatively stable when compared to YE 2024. Of the insurers analysed, only MSIG Europe shows a significant increase in market share.
Figure 10: Split of GWP for YE 2025 by line of business for the Belgian market as a whole
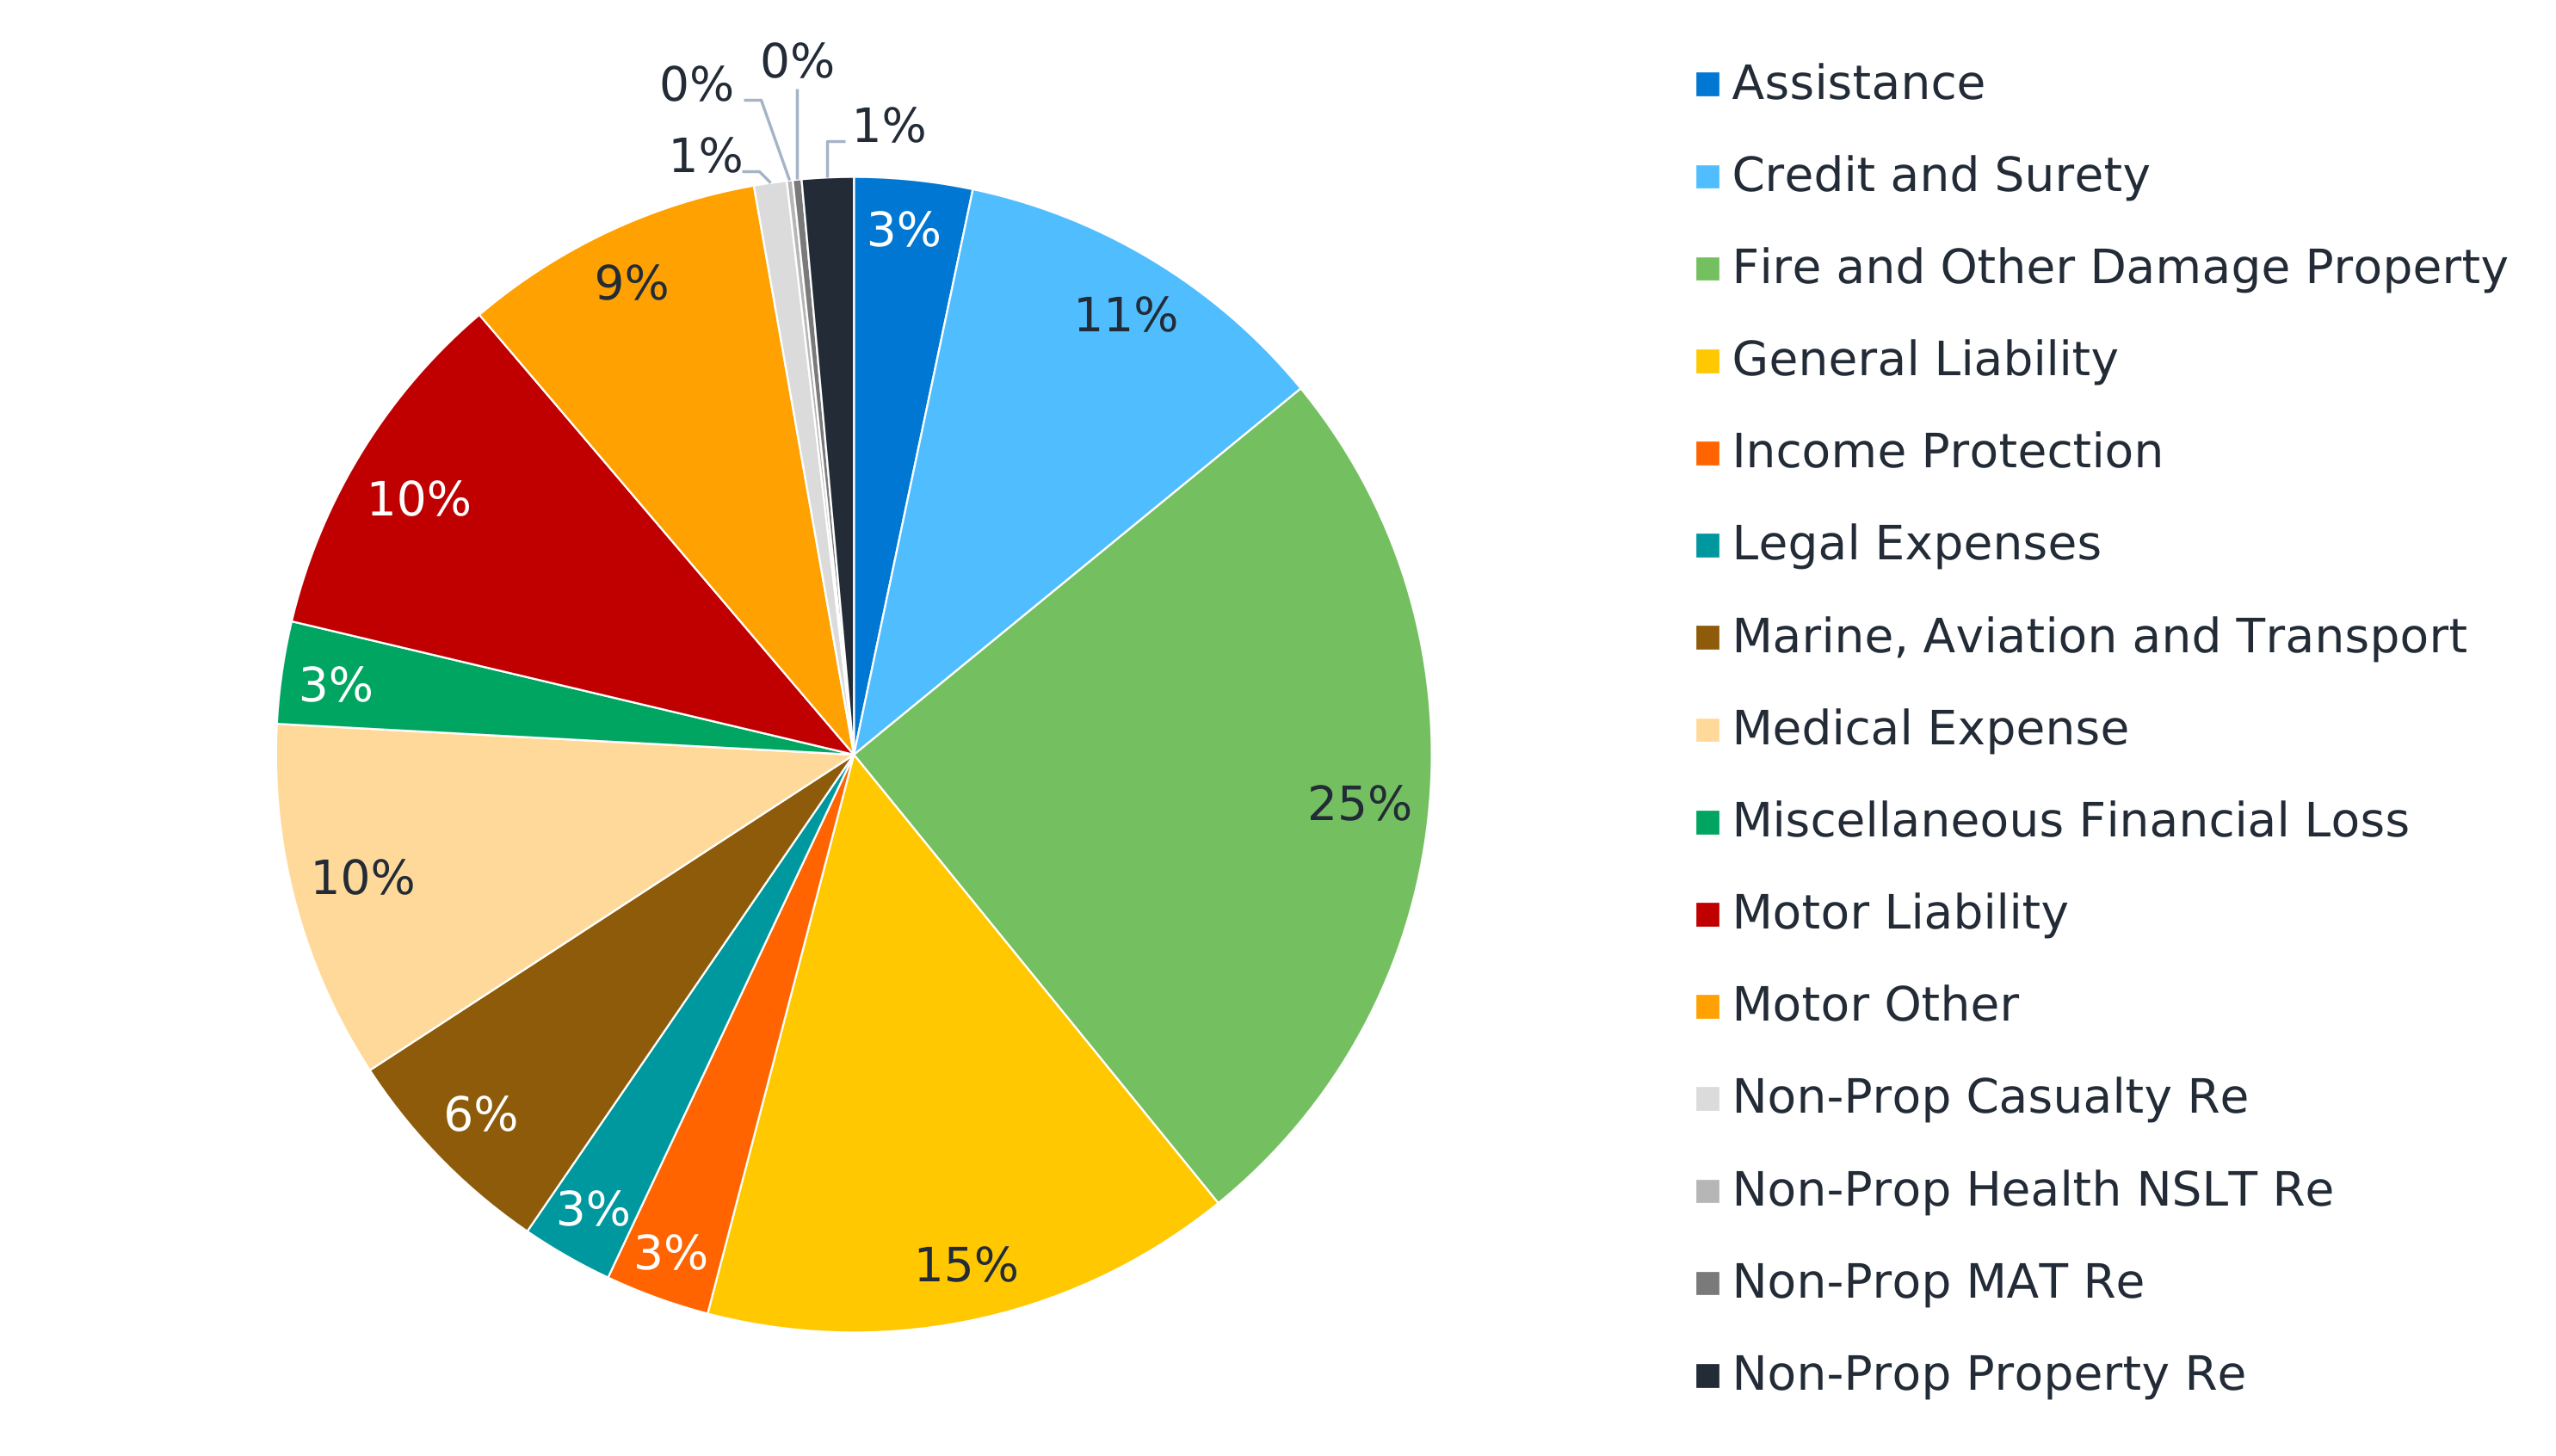
When looking at the non-life GWP at the total market level, the largest line of business on average is property, followed by general liability, credit and surety, motor liability, and medical expense, as detailed in Figure 10.
Analysis of combined ratios
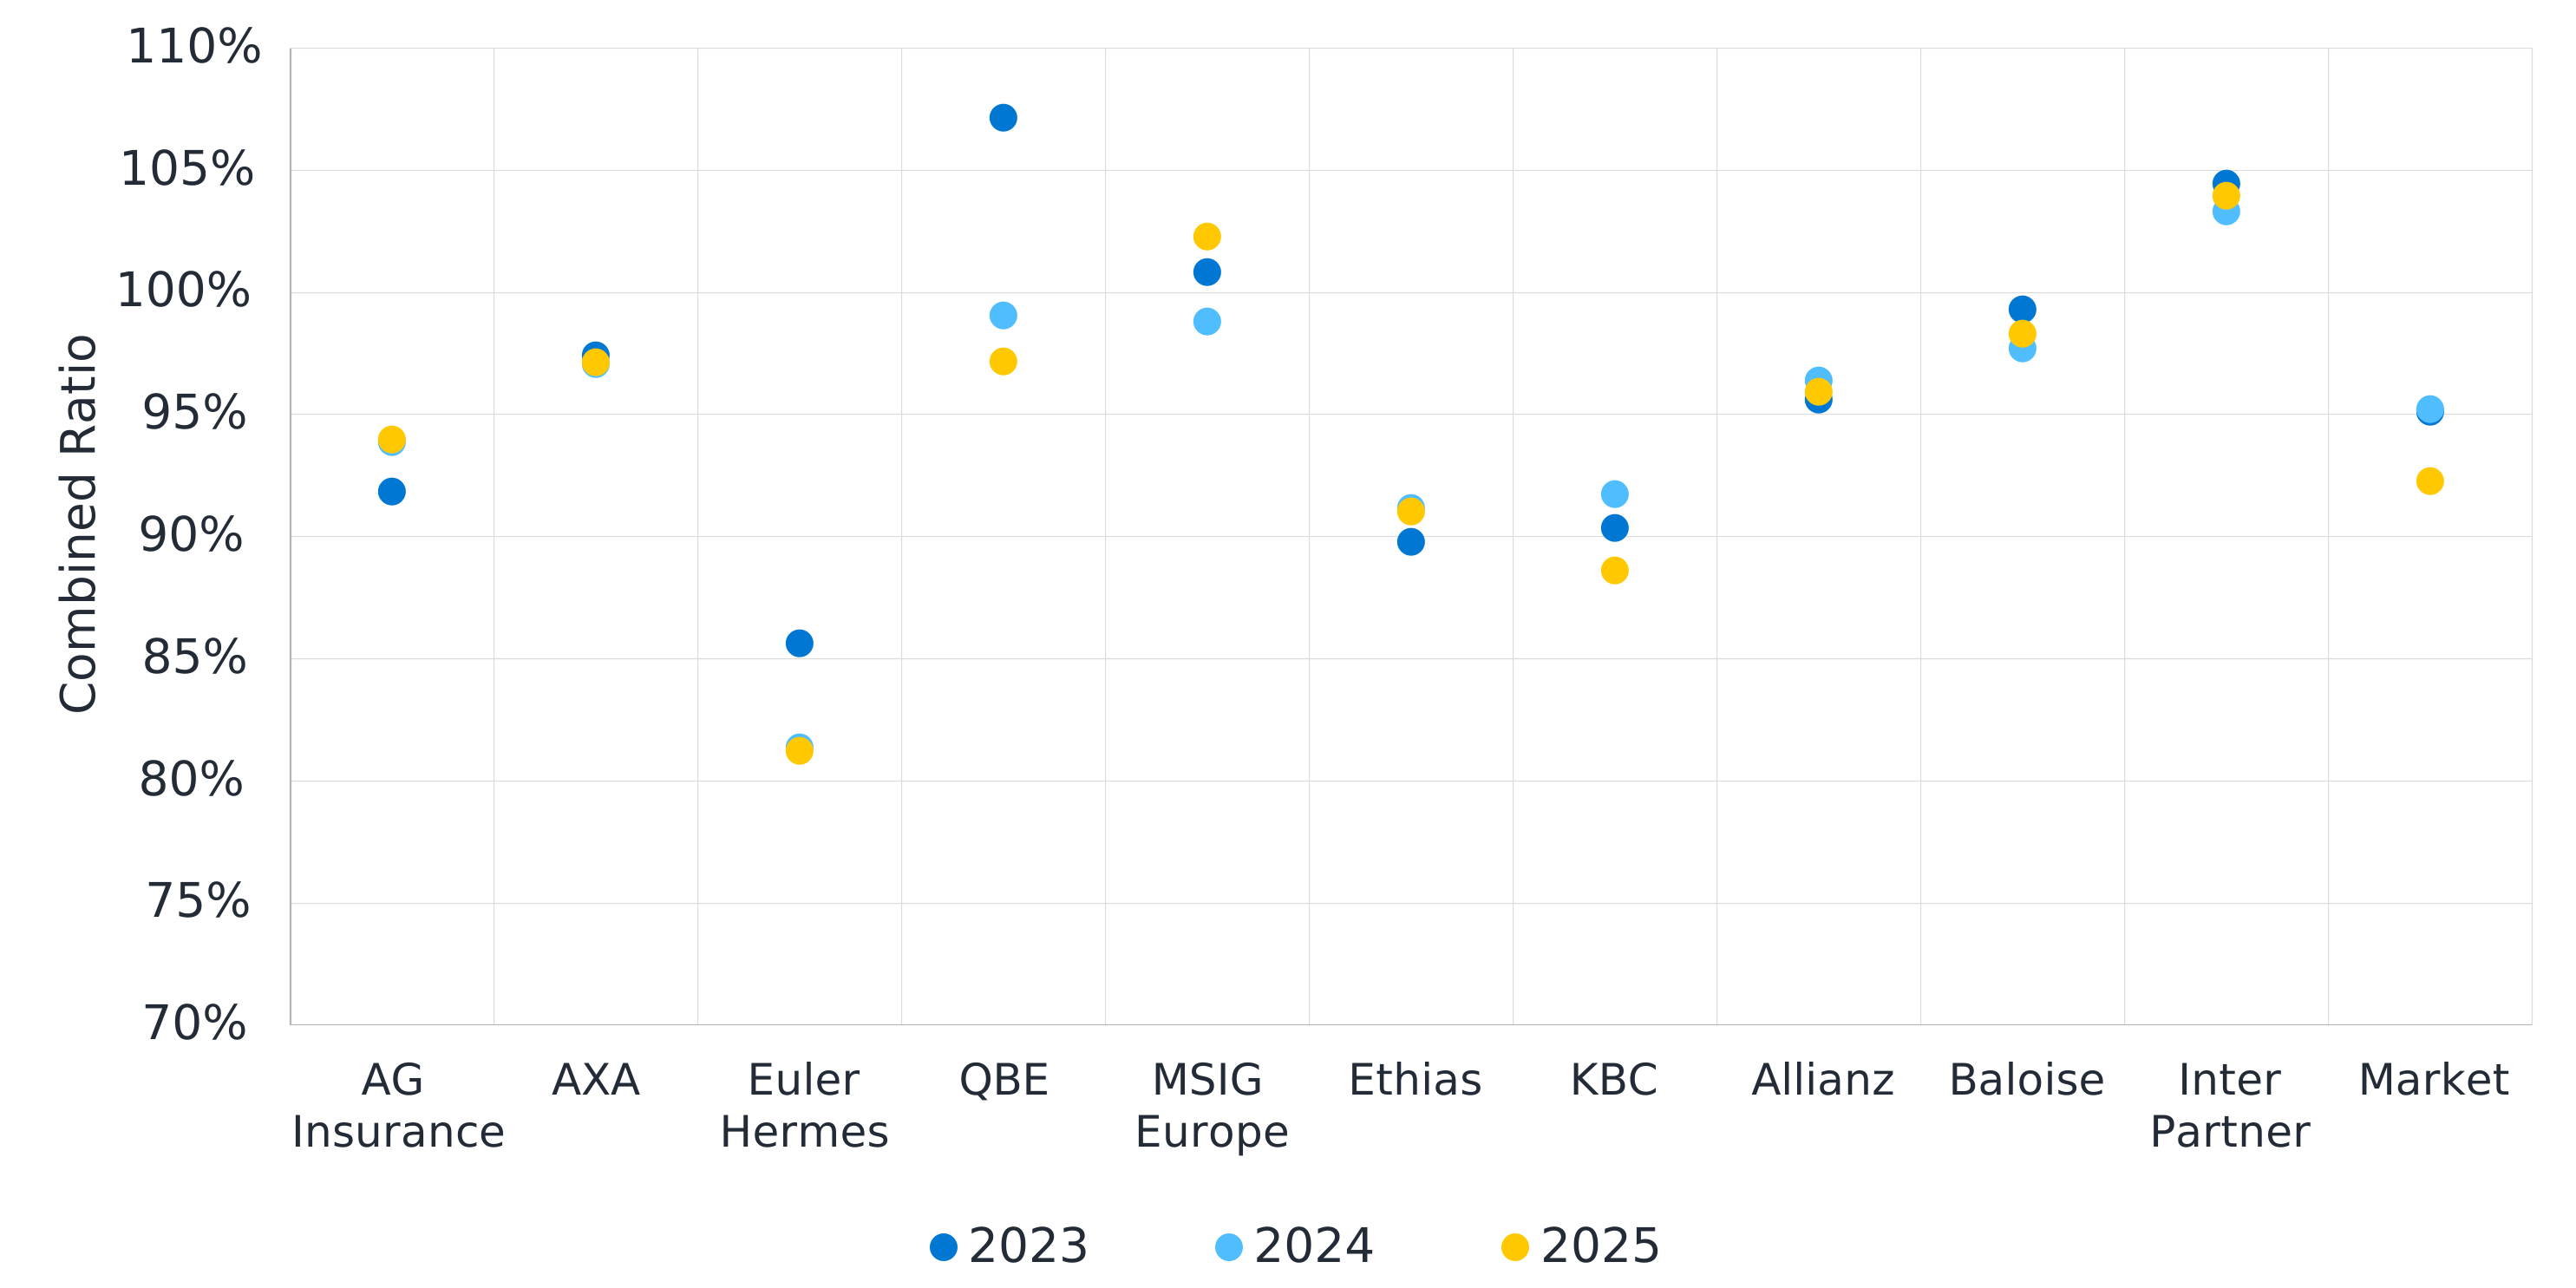
The average combined ratios for Belgian non-life portfolios decreased between YE 2024 and YE 2025.6 Of the 10 biggest non-life insurers (by GWP for YE 2025), KBC Insurance, QBE Europe, Allianz Benelux, Ethias and Euler Hermes saw their ratios decrease, whereas the other insurers saw their ratios improve. Only MSIG Europe and Inter Partner have ratios above 100% for YE 2025. The ratios of all other top 10 companies are below this threshold. These figures are on the non-life portfolio level; the figures at the total company level may differ.
Figure 11: Non-life combined ratios for the 10 largest Belgium insurers (ranked by non-life GWP for YE 2025)
Analysis of expense ratios
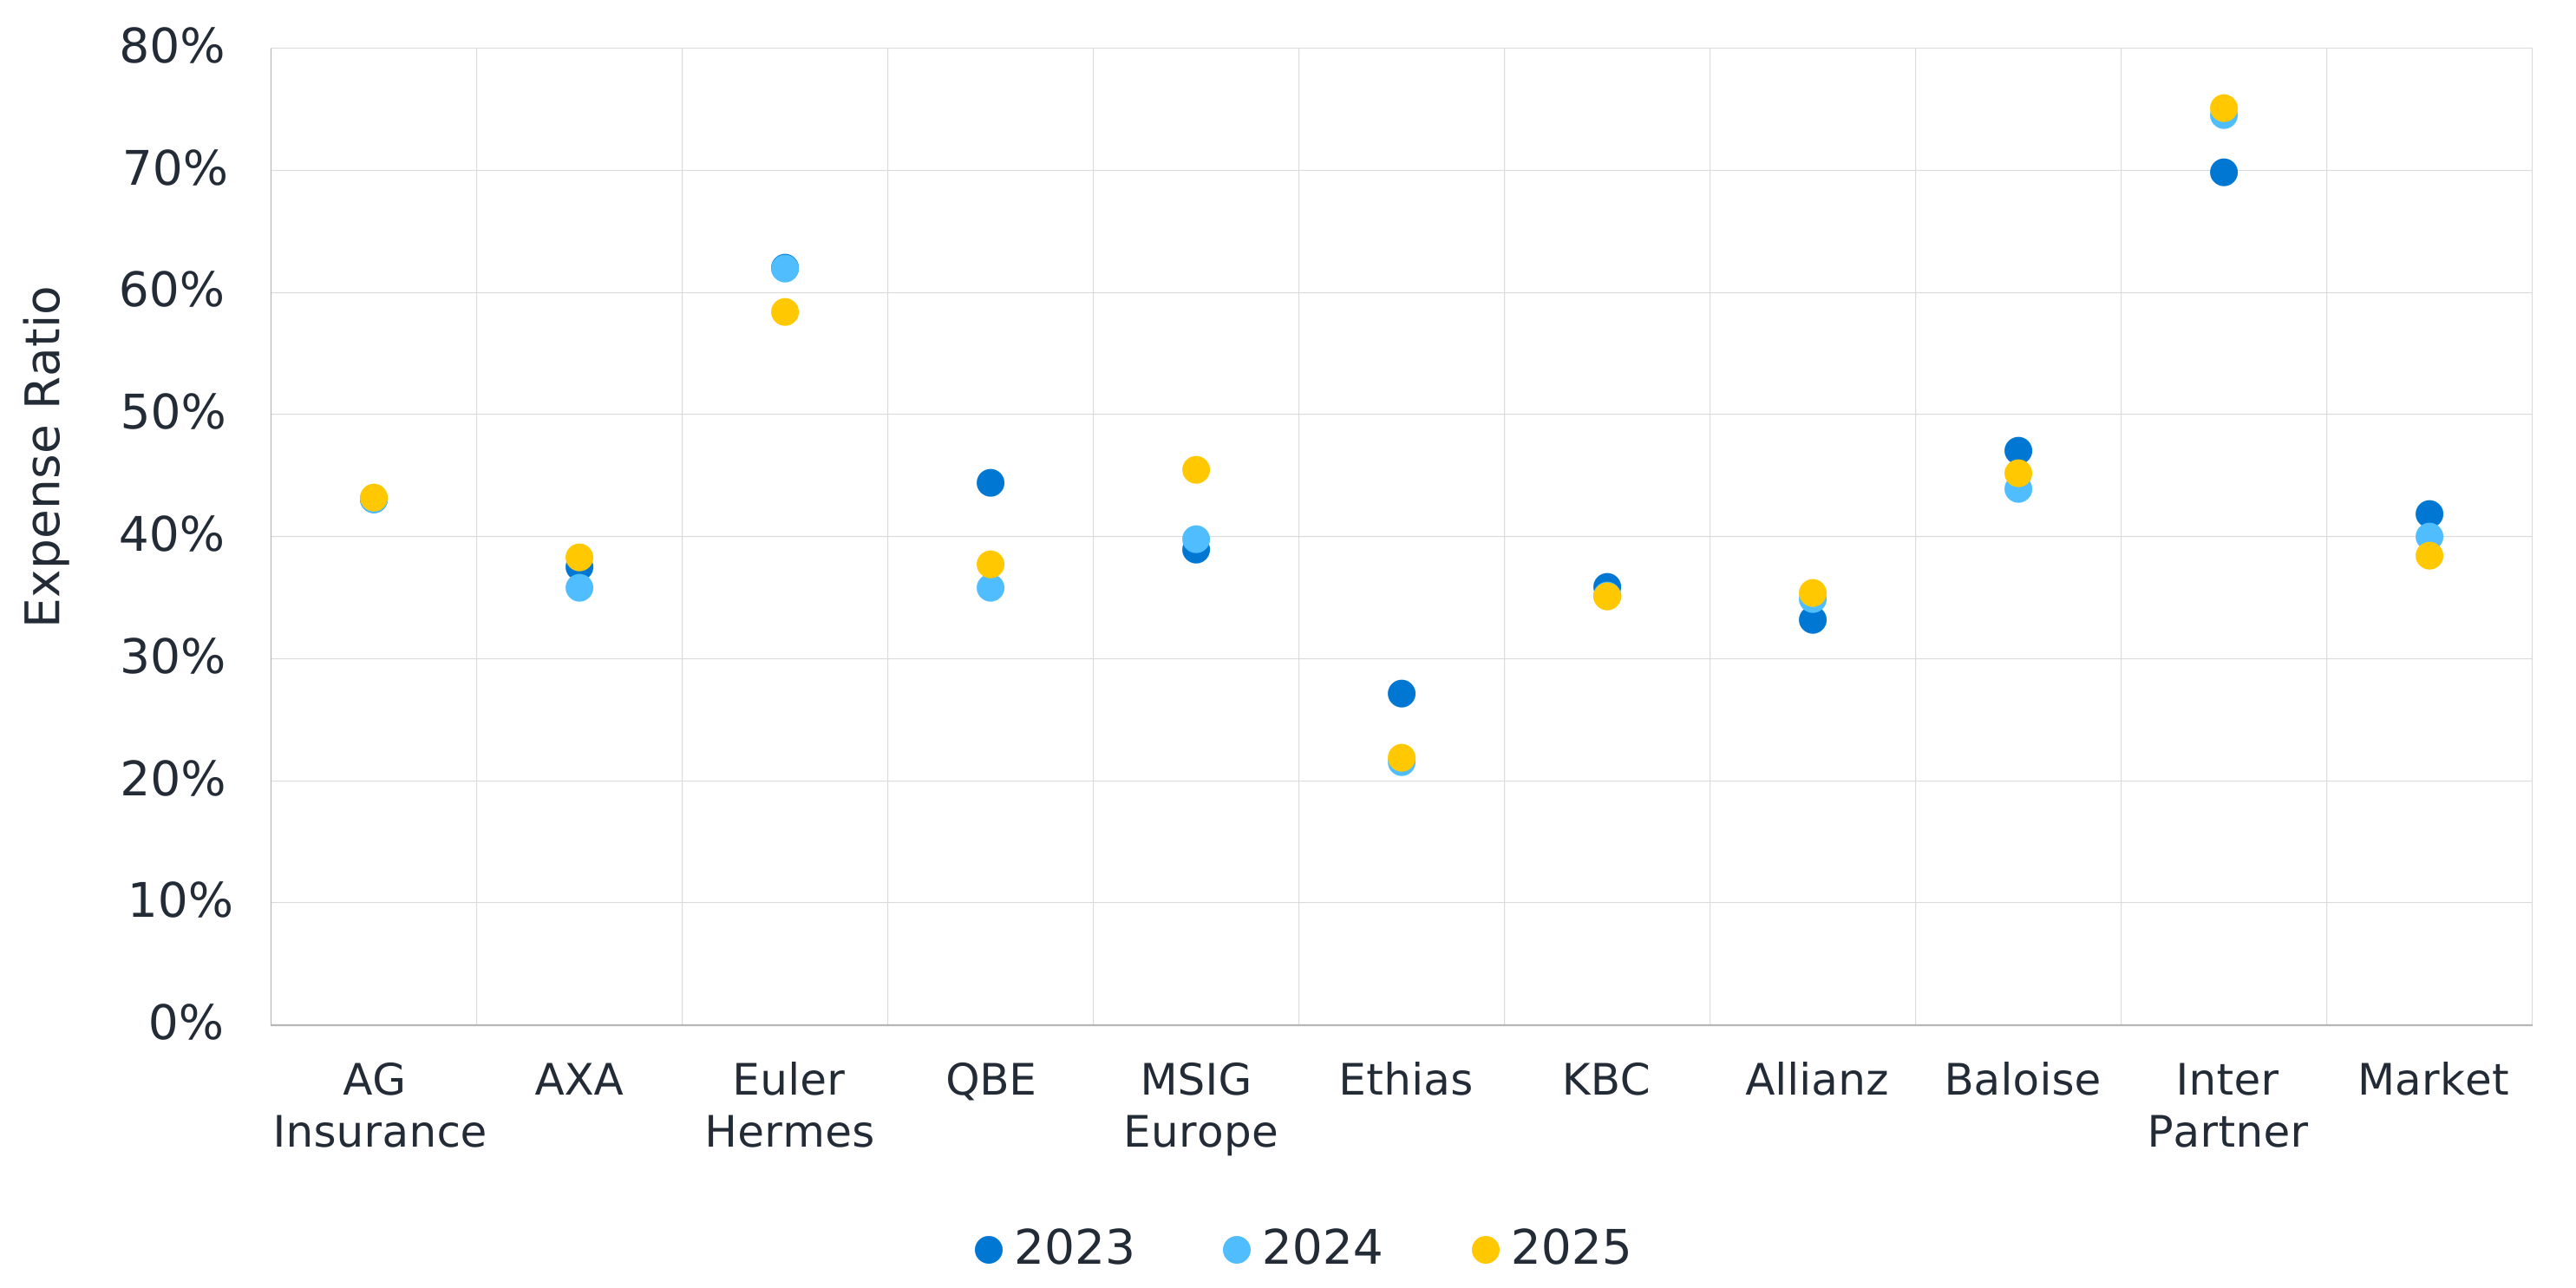
On an aggregate basis, expense ratios decreased slightly from about 40% to 38%. With the top 10 companies on a standalone basis, however, we see from Figure 12 that there is quite some divergence, with expense ratios for YE 2025 ranging between approximately 20% and 75%.
Figure 12: Non-life expense ratios for the 10 largest Belgium insurers (ranked by non-life GWP for YE 2025)
What’s next?
The Solvency II 2020 review introduces key changes that will be phased in over the coming years, including a new approach to interest rate extrapolation, a lower cost of capital for risk margin calculations and stricter calibration of interest rate risk with negative rate scenarios. The VA becomes more countercyclical, long-term equity rules are clarified and SFCR reporting is streamlined. Insurers will need to adapt capital models, investment policies and disclosure processes to align with these evolving requirements.
Milliman Benelux has developed an interactive application to efficiently compare the metrics of insurers as disclosed in their QRTs. If you would like to learn more and get free access to this tool, please follow the link at https://apps.nl.milliman.com or send an email to [email protected].
If you have any questions about or comments related to the information reviewed here or want to discuss additional capital management solutions, please contact your usual Milliman consultant.
Appendix: List of insurers included
|
|
1 All figures included in this report are based on SFCRs published by insurers in the Belgian market and the quantitative reporting templates (QRTs) they attach to the SFCRs. We did not perform an independent audit on these figures.
2 Based on YE 2025 reported EIOPA figures (https://www.eiopa.europa.eu/tools-and-data/insurance-statistics_en).
3 The average SCR coverage ratio across the market is determined as the sum of all SCRs divided by the sum of all EOF of all insurance companies in the sample.
4 Please note that the YE 2024 figures presented here differ from the ones in last year’s SFCR analysis. This is due to a difference in the selection of insurers between this and the previous year’s briefing note.
5 Please note that we did not include Lloyd’s in this percentage due to the unique way in which its business is underwritten. If Lloyd’s were to be included in this analysis, it would be the biggest underwriter in the market, accounting for over 16% of the gross written non-life premiums at YE 2025.
6 The combined ratio is determined as (change in TPs + net claims + expenses) / net earned premiums.